
EMC/EMI Checklist Before Your Board Goes to Certification
EMC testing is expensive, and failing it is worse than the test fee — it costs you a respin, a
ESP32 JTAG debugging offers developers a seamless way to troubleshoot and optimize their projects. Leveraging this feature can significantly enhance the development process, making it easier to identify and fix issues in real-time. With the right setup, you can harness the full potential of the ESP32 microcontroller for your applications. This article will guide you through the process of setting up OpenOCD, providing you with an efficient path to advanced ESP32 debugging.
JTAG, which stands for Joint Test Action Group, is a standard for validating designs and testing printed circuit boards after manufacture. When applied to the ESP32, JTAG debugging allows developers to interact with their devices at a low level, enabling tasks such as monitoring system states, setting breakpoints, and inspecting variable values. This capability is invaluable for those working on complex applications where traditional debugging methods may fall short.
1. Real-Time Analysis: With JTAG, you can run your application and debug it simultaneously. This ability to update and view the effects of your code instantly can lead to faster development cycles.
2. Comprehensive Insights: JTAG interfaces provide in-depth insights into the state of your microcontroller, including memory contents and register states.
3. Ease of Use: Once set up, JTAG debugging can streamline your workflow, making it easier to identify faults and optimize performance.
4. Support for Advanced Features: You can access features like flash memory programming and hardware breakpoints, empowering you to take advantage of the ESP32's capabilities fully.
To begin with JTAG debugging on your ESP32, you’ll need to install OpenOCD, which stands for Open On-Chip Debugger. OpenOCD provides the infrastructure for programming and debugging embedded devices, including the ESP32. Here’s how to get started with your ESP32 OpenOCD setup:
Before diving into the configuration, ensure you have the following items:
- ESP32 Development Board: A compatible development board such as the ESP32 DevKit.
- JTAG Debugger: A JTAG adapter like the FTDI FT2232H or ESP-Prog.
- Computer: To run OpenOCD and your development environment.
1. OpenOCD: Depending on your operating system, you can install OpenOCD via package managers (like Homebrew for macOS or apt for Ubuntu). You can also download it from the OpenOCD release page.
2. IDF (IoT Development Framework): If you are using the ESP-IDF (Espressif IoT Development Framework), make sure you have the latest version, as it comes with the necessary libraries and tools.
OpenOCD requires a configuration file to manage the JTAG interface:
1. Create a Configuration File: Write a new configuration file (e.g., `esp32.cfg`), specifying the JTAG interface and ESP32 capabilities. An example configuration might look like this:
```
interface ft2232
ft2232_vid_pid 0x0403 0x6015
ft2232_layout esp32
ft2232_device_desc "FT232R USB UART"
jtag_device 0x6010
```
2. Load the Default ESP32 Configuration: Include the default configurations provided by the ESP-IDF, typically found in the `esp-idf/components/openocd/esp32.cfg`.
Ensure that your JTAG adapter is correctly connected to your ESP32 board. The wiring should be as follows:
- TCK (Test Clock)
- TDI (Test Data In)
- TDO (Test Data Out)
- TMS (Test Mode Select)
- GND (Common Ground)
Run OpenOCD from the command line using the configuration file:
```bash
openocd -f interface/ftdi/esp32.cfg -f board/esp32-wroom-32.cfg
```
Once OpenOCD initializes successfully, it will open a gdb server that can connect to development tools like GDB (GNU Debugger).
With OpenOCD running, you can deploy your application from your development environment (like Eclipse, VSCode, or command line) and connect GDB to OpenOCD. Use the commands to set breakpoints and inspect variable values in real-time.
ESP32 JTAG debugging significantly enhances your development capabilities, allowing for more efficient troubleshooting and performance optimization. By following this seamless OpenOCD setup guide, you’ll equip yourself with the advanced ESP32 debugging tools necessary to take your projects to new heights. Whether you are developing IoT applications or custom embedded solutions, mastering JTAG debugging will pave the way for a more effective development experience.
======================================
 Waveshare ESP32-S3 PhotoPainter: 7.3" E6 E-Paper Display in Wood Frame, 800×480, Ultra-Low Power
$84.80
Waveshare ESP32-S3 PhotoPainter: 7.3" E6 E-Paper Display in Wood Frame, 800×480, Ultra-Low Power
$84.80
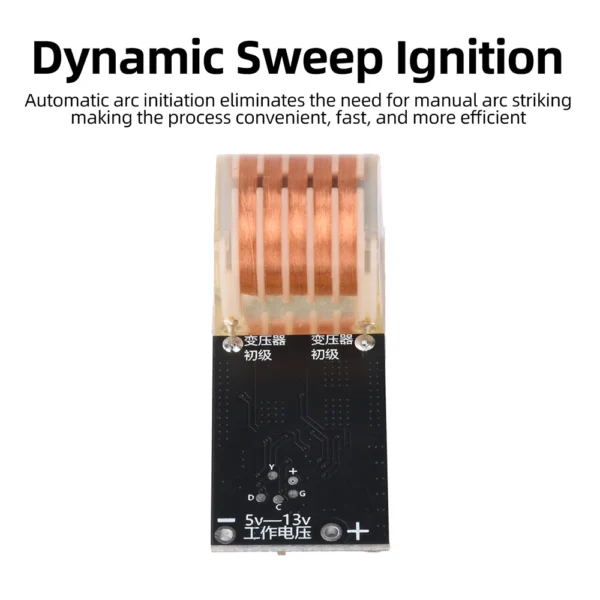 20KV High Voltage Generator Arc Igniter Module with Overheat Protection for DIY Electronics and Scientific Experiments
$4.60
20KV High Voltage Generator Arc Igniter Module with Overheat Protection for DIY Electronics and Scientific Experiments
$4.60
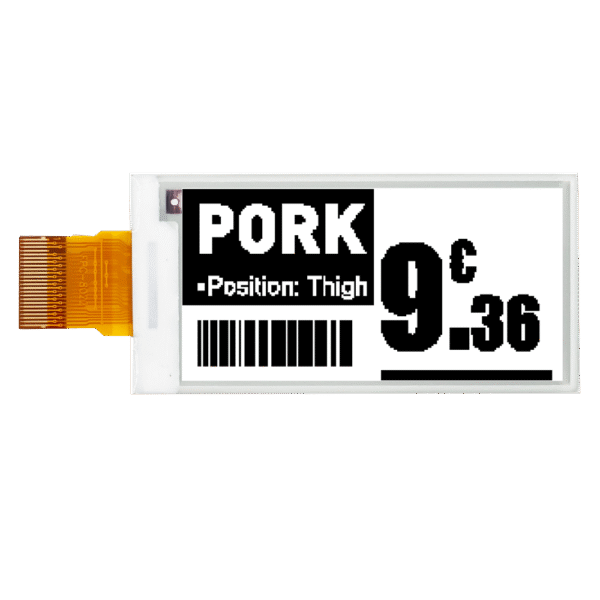 2.13 Inch Black White ePaper Display
$3.20
2.13 Inch Black White ePaper Display
$3.20
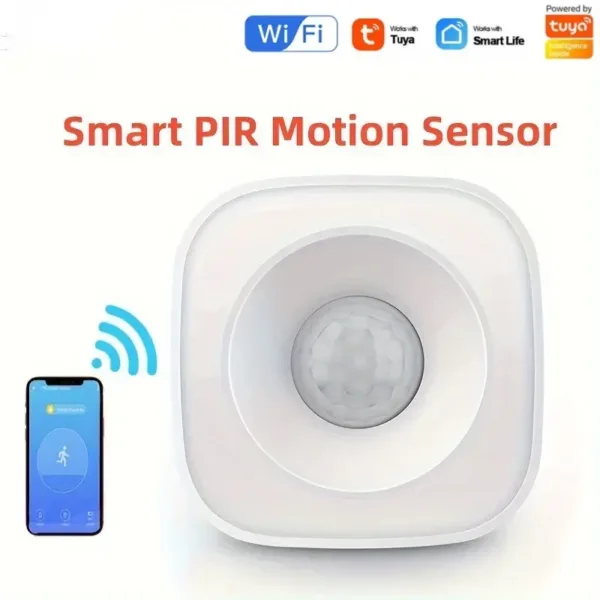 Smart WiFi/ZigBee PIR Motion Sensor - Wireless Infrared Security Detector, APP Alerts, Smart Home Burglar Alarm System
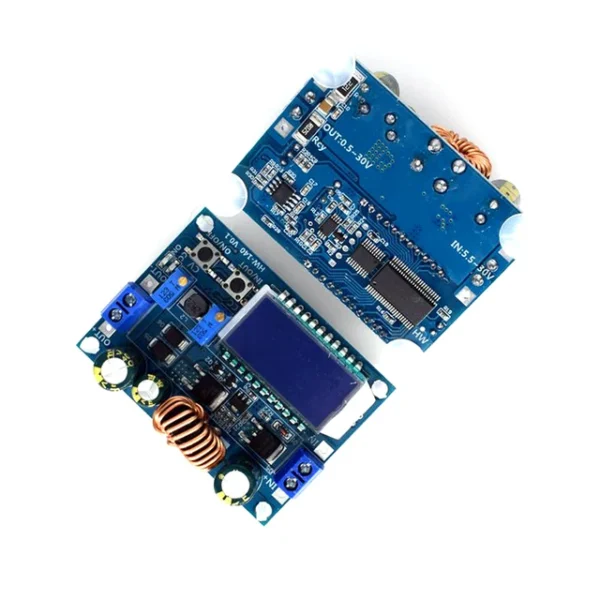 DC-DC Buck Boost Converter Module 5.5-30V to 0.5-30V 4A 35W Adjustable Step Up Down Voltage Regulator LCD Digital Voltmeter
$3.90
DC-DC Buck Boost Converter Module 5.5-30V to 0.5-30V 4A 35W Adjustable Step Up Down Voltage Regulator LCD Digital Voltmeter
$3.90
EMC testing is expensive, and failing it is worse than the test fee — it costs you a respin, a
We review a lot of boards — some designed in-house, some by other contractors, some by founders doing their own
When a battery-powered product dies too soon, the instinct is to blame the firmware. Surely there is a sleep mode
A wearable PCB is not just a small PCB. It is a board where every constraint that normally has some
The STM32 family is the workhorse of embedded hardware, and almost every project that uses one starts the same way:
The nRF52840 is one of the most popular BLE and multiprotocol chips in the world, and for good reason: it
No account yet?
Create an Account