
EMC/EMI Checklist Before Your Board Goes to Certification
EMC testing is expensive, and failing it is worse than the test fee — it costs you a respin, a
ESP32 JTAG debugging is a powerful way to unwind complex tasks and enhance the overall development experience. With its extensive features, the ESP32 platform has gained traction among developers, making it crucial to effectively leverage its debugging capabilities. This article will guide you through a streamlined OpenOCD setup, enabling you to utilize JTAG debugging effortlessly.
JTAG (Joint Test Action Group) is a valuable interface that allows developers to monitor the operation of their devices directly. With ESP32 JTAG debugging, developers can take advantage of features like breakpoints, watchpoints, and step execution, significantly improving troubleshooting efficiency. This method provides greater visibility into the operation of your code, making it easier to identify issues that might go unnoticed during regular testing.
OpenOCD (Open On-Chip Debugger) is an open-source tool that serves as a bridge between your debugging hardware and the development environment. Using OpenOCD with the ESP32 allows developers to perform advanced debugging tasks seamlessly. With its capability to interface with various hardware debuggers, OpenOCD has become a go-to solution for developers seeking a flexible and robust debugging setup.
Setting up ESP32 with OpenOCD may seem daunting at first, but with a systematic approach, it can be accomplished easily.
Before diving into the setup, make sure you have the following:
- ESP32 Development Board: The board must support JTAG debugging.
- JTAG Debugger: There are several options available, including ESP-Prog and FTDI-based debuggers.
- USB Cable: Used to connect your ESP32 board to your development machine.
- Development Environment: This could be any IDE that supports OpenOCD, such as Visual Studio Code or Espressif IDF.
1. Download OpenOCD: Navigate to the OpenOCD official website to download the latest version. You can use package managers like Homebrew for macOS or APT for Ubuntu to simplify the installation.
2. Install Dependencies: Ensure that your system has the required dependencies. This often includes development packages and libraries. For most platforms, basic development tools will suffice.
3. Build OpenOCD: If you downloaded the source code, follow the instructions to build it. This usually involves commands like `./configure`, `make`, and `make install`.
Creating a configuration file tailored for your ESP32 board is essential:
1. Open a Text Editor: Create a new file, for example, `esp32.cfg`.
2. Add Configuration Details: Insert the following sample configuration into your file:
```cfg
interface ft2232
ft2232_device_desc "USB Blaster"
ft2232_layout "oxygen"
adapter_khz 1000
# ESP32 settings
source [find interface/ftdi/esp32.cfg]
transport select jtag
reset_config srst_only
init
```
Adjust the parameters as necessary to match your specific JTAG setup.
Using the USB cable, connect your JTAG debugger to the ESP32 board. Ensure that the connection is secure. The typical pin connections to look out for are TCK, TMS, TDI, and TDO, along with the necessary power and ground connections.
Once everything is set up:
1. Open Terminal: Navigate to the directory where your configuration file is stored.
2. Run OpenOCD: Execute the command:
```bash
openocd -f esp32.cfg
```
If configured correctly, you should see messages indicating that OpenOCD has successfully connected to your hardware.
With the setup complete, you can now leverage advanced debugging features. For example:
- Set Breakpoints: Insert breakpoints in your code to pause execution at critical points. This allows for inspection of variable values and stack traces.
- Examine Memory: Utilize commands to read the memory addresses. This feature is invaluable when analyzing the state of your program during runtime.
- Step Through Code: You can execute your program one line at a time to closely monitor behavior and identify unexpected results.
With the straightforward steps outlined above, you can effortlessly set up ESP32 JTAG debugging using OpenOCD. This powerful tool not only enhances your debugging capabilities but also facilitates deeper insights into your code's execution. By mastering these techniques, you pave the way for a more efficient development process, ensuring that your ESP32 projects come to life with fewer hurdles. Enjoy your debugging journey!
======================================
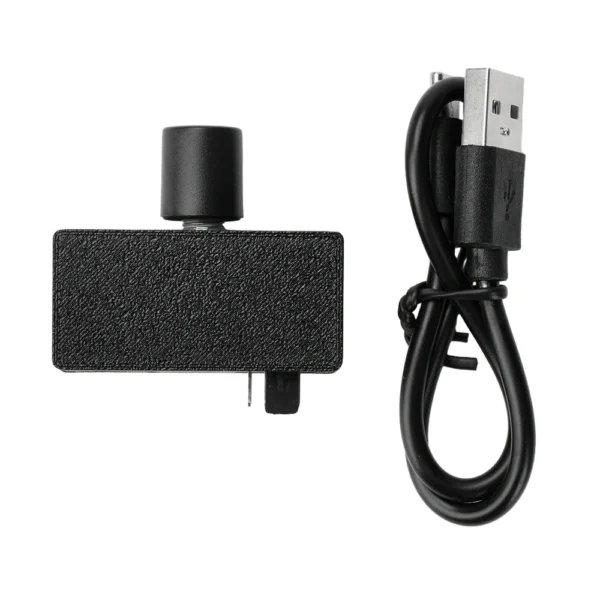 DC12V PWM Speed Controller 4-Pin Fan Speed Controller Type-C USB Power Supply DIY Water-cooling Cooling Pulse Width Modulation
$3.90
DC12V PWM Speed Controller 4-Pin Fan Speed Controller Type-C USB Power Supply DIY Water-cooling Cooling Pulse Width Modulation
$3.90
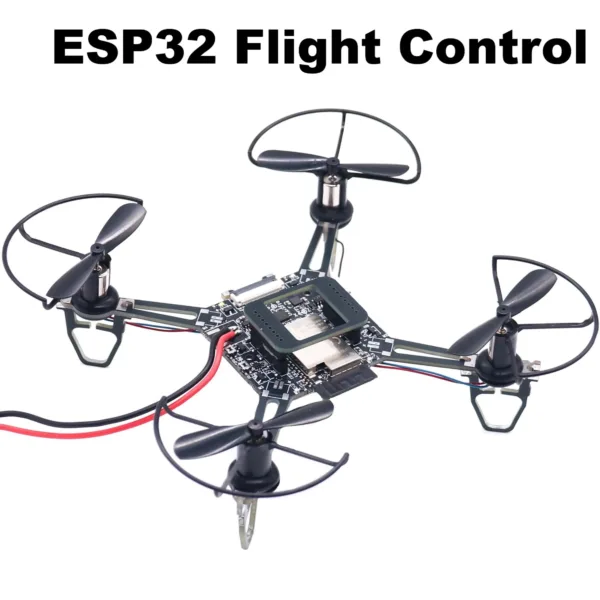 ESP32S2 ESP32 Flight Control Open Source Quadcopter ESP-Drone Drone Model Wifi Remote Control Crazyflie
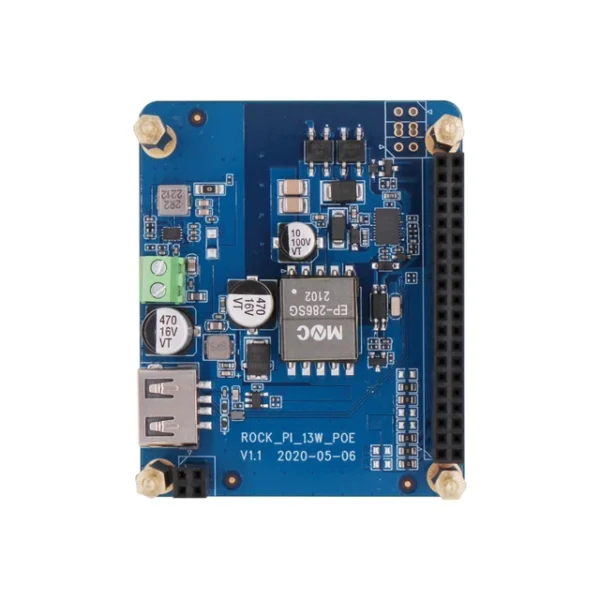 Radxa 13W PoE HAT, Compatible with ROCK Pi E
$28.90
Radxa 13W PoE HAT, Compatible with ROCK Pi E
$28.90
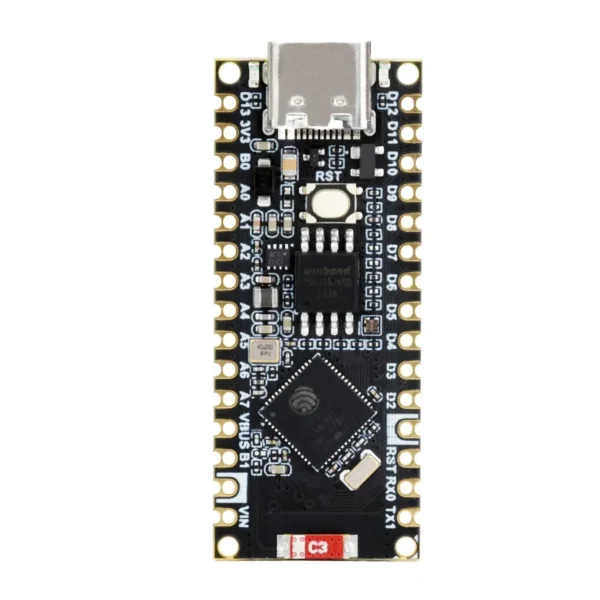 Waveshare ESP32-S3-Nano Development Board, Based on ESP32-S3R8, Compatible with Arduino Nano ESP32
$9.80 – $10.80Price range: $9.80 through $10.80
Waveshare ESP32-S3-Nano Development Board, Based on ESP32-S3R8, Compatible with Arduino Nano ESP32
$9.80 – $10.80Price range: $9.80 through $10.80
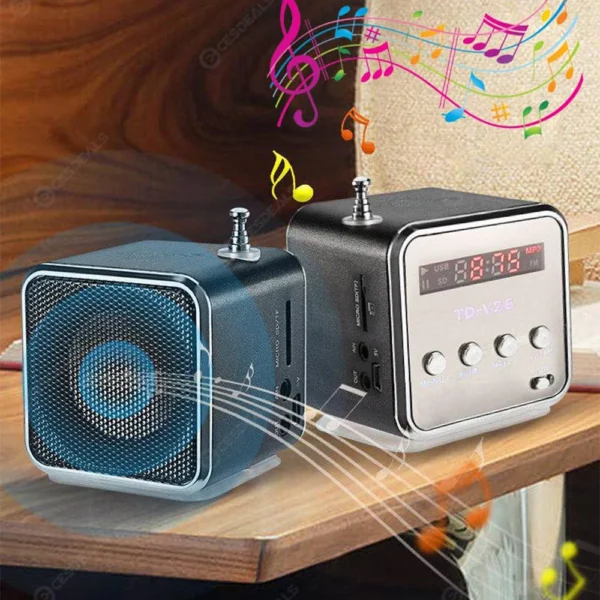 Portable TD-V26 Digital FM Radio Wireless Speaker Mini FM Radio Receiver LCD Display Stereo Loudspeaker Support SD/TF Card
$6.90
Portable TD-V26 Digital FM Radio Wireless Speaker Mini FM Radio Receiver LCD Display Stereo Loudspeaker Support SD/TF Card
$6.90
EMC testing is expensive, and failing it is worse than the test fee — it costs you a respin, a
We review a lot of boards — some designed in-house, some by other contractors, some by founders doing their own
When a battery-powered product dies too soon, the instinct is to blame the firmware. Surely there is a sleep mode
A wearable PCB is not just a small PCB. It is a board where every constraint that normally has some
The STM32 family is the workhorse of embedded hardware, and almost every project that uses one starts the same way:
The nRF52840 is one of the most popular BLE and multiprotocol chips in the world, and for good reason: it
No account yet?
Create an Account